In the three months ending May 2026, the median sale price for a home in Holbrook climbed to $574,656, up 10.5% from the same stretch a year earlier. Over that same window, the median price per square foot in town dropped 3.6%, down to $403. Read those two numbers side by side and something looks off. Prices are rising and falling in the same market, over the same three months, depending on which figure you're looking at.
Both are true. Neither is the whole picture. And if you're shopping in Holbrook right now, understanding why they diverge matters more than either number on its own.
What Actually Moved
A rising median price with a falling price per square foot almost always means the same thing: the mix of homes that sold changed, not the value of any individual home. Bigger houses closed. Smaller ones didn't, or closed less often. The median climbs because bigger, pricier homes pull it up. The per-square-foot figure falls because those bigger homes, dollar for dollar, cost less per foot than the smaller ones that used to dominate the sales mix.
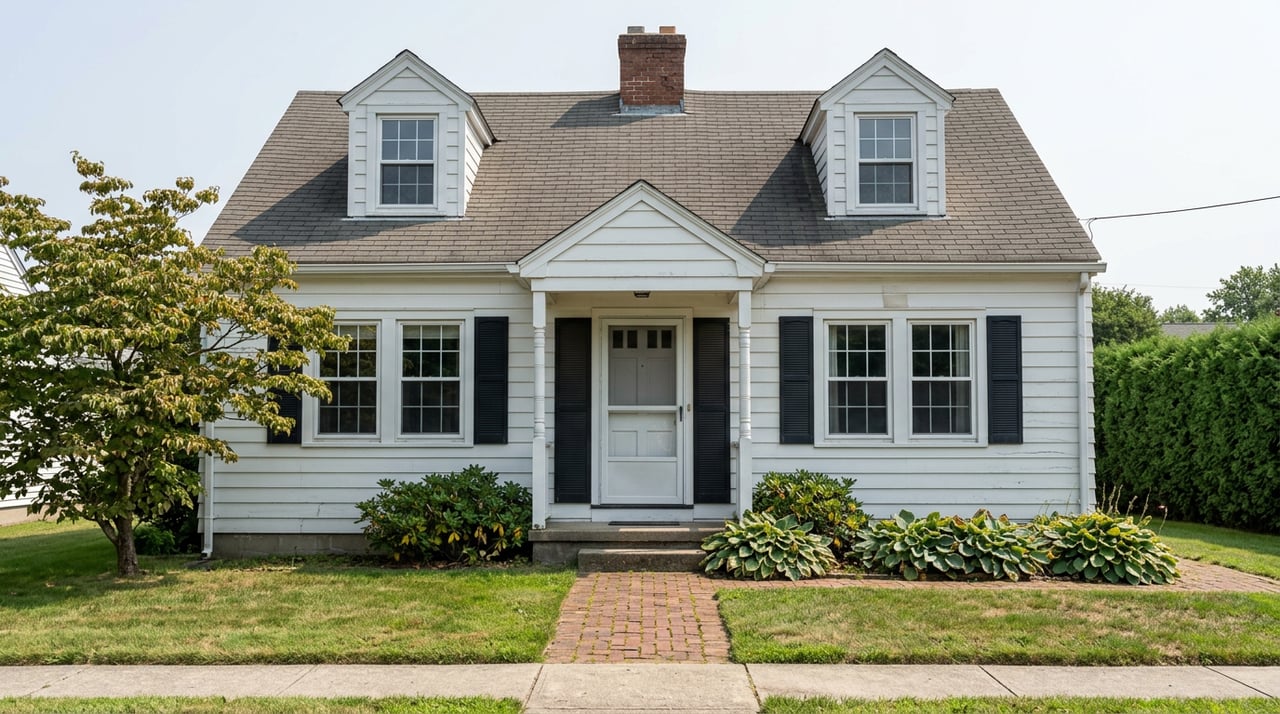
Holbrook's housing stock makes this kind of swing easy to produce. More than half the town's homes, about 51%, were built between the 1940s and the 1960s, according to NeighborhoodScout's analysis of Census and resale data, mostly modest capes and ranches from the postwar building boom. Single-family homes account for roughly 83% of all housing units in town. That's a lot of similarly sized, similarly aged homes competing in a fairly narrow price band, which means it doesn't take many larger or updated properties changing hands to shift the per-square-foot average without shifting what any individual home is actually worth.
It also doesn't take much volume. Only 30 homes sold in Holbrook in May 2026, up from 25 the year before. In a market that small, a few outliers carry real statistical weight. A single large lot with multiple parcels, or a handful of updated capes with finished second floors, can move both the median and the per-square-foot number in opposite directions in the same month.
Asking Prices Are Telling a Different Story Than Closed Sales
Here's where it gets more interesting for anyone shopping right now rather than looking backward. Closed sale prices are a lagging number. They reflect offers accepted 30 to 60 days before the deal closed, when a different set of buyers was competing under different conditions. What sellers are asking for today tells you where the market is heading, not where it's been.
In July 2026, Holbrook's median list price was $554,000, down roughly 8% from the prior month and down about 8% from July 2025. List price per square foot came in at $368, down 3 to 4% over the same comparisons. Homes spent a median of 27 days on the market in July 2026, essentially flat compared to July 2025.
Put together, that means the strong closed-sale numbers from earlier in the year reflect deals that were negotiated when the market still had some heat in it. What's coming onto the market now is priced more conservatively. If you've been watching Holbrook's headline price and bracing for a bidding war, the current asking-price trend suggests you have more room to negotiate than the spring's closed sales would imply.
What a Buyer's Dollar Reaches in Holbrook Versus Its Neighbors
Holbrook's price sits in a specific spot on the South Shore map, and that spot is worth seeing in context. Zillow's current estimated home values put the town's near neighbors in this range:
| Town | Typical Home Value |
|---|---|
| Brockton | $506,468 |
| Whitman | $551,264 |
| Rockland | $556,119 |
| Holbrook* | $574,656 |
| Randolph | $590,774 |
| Abington | $599,647 |
| Weymouth | $622,984 |
| Quincy | $679,882 |
| Braintree | $739,142 |
| Milton | $1,087,237 |
*Holbrook's figure reflects the median closed sale price for the three months ending May 2026, a slightly different measure than Zillow's estimated home value used for the other towns, shown here for a directional comparison rather than an exact one.
Holbrook lands solidly in the middle of that list, more expensive than Whitman and Rockland, less expensive than Randolph, Weymouth, Quincy, and Braintree. For a buyer priced out of Weymouth or Braintree but not ready to commit to Brockton, Holbrook occupies a real middle ground, and the per-square-foot softening happening right now makes that middle ground a little more accessible than the headline median suggests.
The same pattern holds for renters, which matters if you're weighing a two-family purchase or an investment property. Holbrook's median asking rent runs around $2,025, noticeably below Randolph's roughly $2,225 to $2,300, Weymouth's $2,400, and Braintree and Quincy's roughly $2,500. For an investor comparing rental income potential against purchase price across these towns, Holbrook's combination of moderate purchase prices and moderate rents is worth running the numbers on directly rather than assuming it tracks with its pricier neighbors.
Same Station Name, Different Town
One detail trips up more buyers than it should. The train stop everyone calls the Holbrook station isn't actually in Holbrook. The Holbrook/Randolph stop sits at Union Street and Center Street in Randolph, roughly three miles from downtown Holbrook, and it's the closest commuter rail access point for Holbrook residents. From there, it's about a 30-minute ride to South Station, and Braintree's Red Line station is about six miles away, with an MBTA bus route connecting Holbrook to Quincy directly.
None of that makes the commute worse. It just means the "walk to the train" search filter won't work the way it does in towns where the station sits inside the town line. If rail access is part of your decision, factor in the short drive or bus connection to get there, and weigh that against homes closer to the Braintree Red Line stop if a car-free commute matters more than square footage.
What the Town Is Betting On
Holbrook's own downtown economic development study, produced through the Metropolitan Area Planning Council, lays out where the town wants growth to happen next. The study points to newer market-rate housing in the downtown core as a draw specifically because it offers walkable access to services, and it recommends marketing efforts aimed at commuter rail passengers, including the idea of local business discounts for riders who show a rail pass. The same study names Randolph Savings Bank and Brook Kitchen and Tap Restaurant among the businesses anchoring the downtown's day-to-day economy.
That's a town planning for density and foot traffic near its rail connection, not a town expecting to stay exactly as it is. If you're buying with a five- or ten-year horizon, downtown proximity is worth weighing alongside square footage and price per foot. It's one more variable in a market where the easy headline number doesn't tell the full story.
Reading Price Per Square Foot Like You Live Here
A few habits make the difference between reacting to a headline and actually understanding a house's value:
- Ask for comps sorted by square footage, not just by recent sale price. Two homes at $575,000 can differ by 400 square feet.
- Check the build year. A 1950s cape and a fully renovated 1990s colonial will price very differently per square foot even at similar total prices.
- Watch list price trends, not just closed sale trends. Closed sales tell you what already happened. Active list prices tell you what's likely to happen next.
- In a small market like Holbrook, don't over-read a single month's swing. Look at a rolling three-month window before drawing conclusions.
A Few Questions Worth Asking Before You Write an Offer
Why would a home's median price rise while price per square foot falls in the same market? It usually means the mix of what sold changed. Larger homes closing in a given period will pull the median price up even as the cost per square foot trends down, especially in a small market where a handful of sales carry outsized weight.
Is the Holbrook/Randolph commuter rail station actually walkable from Holbrook? No. It sits in Randolph, at Union and Center Streets, about three miles from downtown Holbrook. Plan for a short drive or bus connection rather than a walk.
Does the current data mean I should expect a bidding war in Holbrook? Not necessarily. July 2026 list prices ran about 8% below the prior year, and days on market held steady around 27. The spring's strong closed-sale numbers reflect deals negotiated months earlier under different conditions.
If you're weighing Holbrook against Randolph, Weymouth, or Rockland, or trying to figure out what a specific listing's price per square foot actually tells you about its value, I'd rather walk through the real comps with you than let a headline number make the decision for you. Angela Bergin has spent more than two decades reading these exact patterns across the South Shore. Let's Connect and figure out what your budget really reaches in this market.